The server screen (Menuitem “Server”) gives access to server information, such as the logs or cache settings. Some of the information are node specific, meaning that in a clustered system, each server will display information that are specific to the current machine. Node specific information are: Current server cache, Server Log, artifact information (installed components), ssl certificates and server stats.
Cache Maintenance
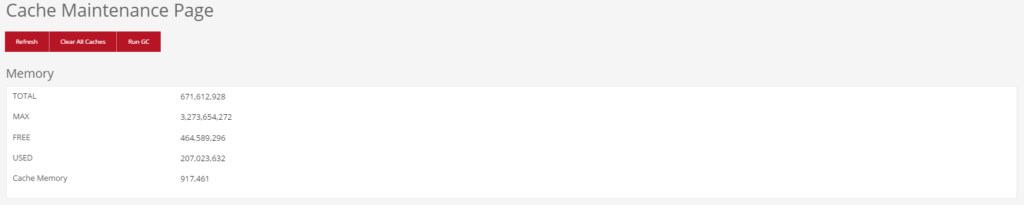
Cache maintenance can be accessed by navigating to “Server » Cache”. The page outlines the current memory allocation and allows the administrator to clear the cache or run the java garbage collector (GC). The subsequent table gives access to individual cache elements and displays each individual statistics, such as cache element expiration time or used cache memory.
Server Log
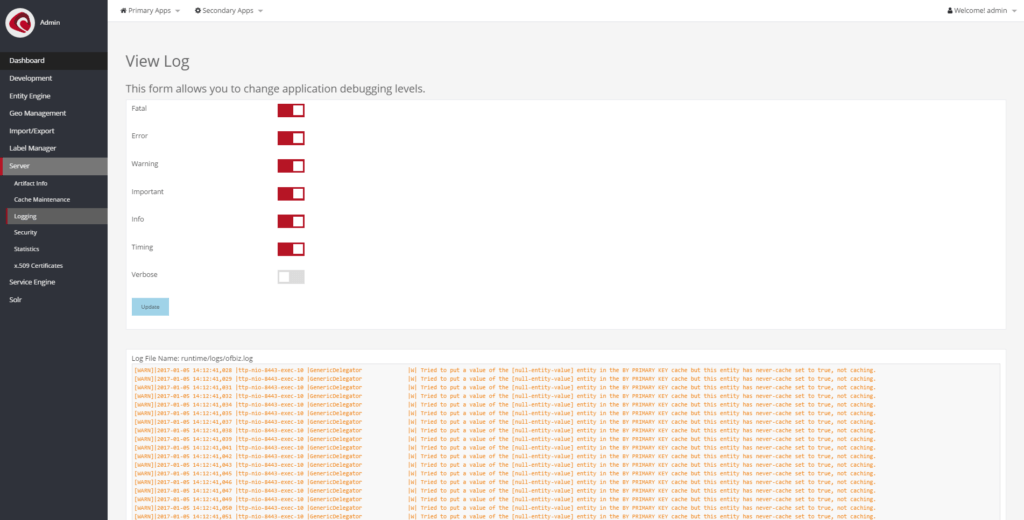
The server logs can be accessed through “Server » Logging” (and on the dashboard). The log information are read from file (\runtime\logs) and are configurable through \framework\base\config\log4j2.xml. The default log levels can be overridden by action buttons, displayed on top of the page.
Artifact Info
Artifact information can be access through “Server » Artifact Info”. They represent information about individual components, their current status and and the webapps they contain. The “Artifact Info Search” also gives access to further common elements of a component:
- Entities
- Services
- Widgets
- Forms
- Screens
- Requests & Views
This alone makes the artifact info screen a handy tool for developers, as you can easily find the location of an artifact and gain information on how they are being used within the system.
Security
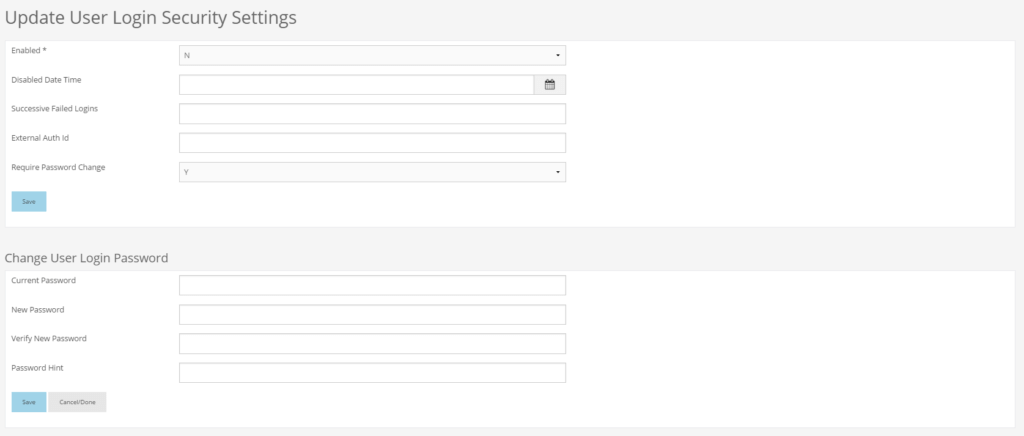 The security screen, accessible through “Server » Security”, gives easy access to user account information. Here the administrator can modify a user-account or reset a password, if must be. It is possible to modify individual user-accounts as well as user-groups. Unlike other screens of the server information, these information are stored in the database and are not server-specific.
Statistics
The server stats can be accessed through “Server » Statistics”. The table lists request-, event- & view-information, grouped by component & event/request/view. If desired, then further detail are available by clicking the “View Bin” button.